Component library dedicated to simplifying interactive visualization building in Vue.js.
Vuesalize is a library that aims to simplify the process of building interactive visualizations on the web, especially within a Vue.js project. It provides a set of chart components and other components commonly used in building interactive visualizations. The charts are built using a combination of Vue.js and D3.js, with the SVG definitions moved to the template in order to take advantage of Vue’s virtual DOM and make updating and interacting with the charts easier.
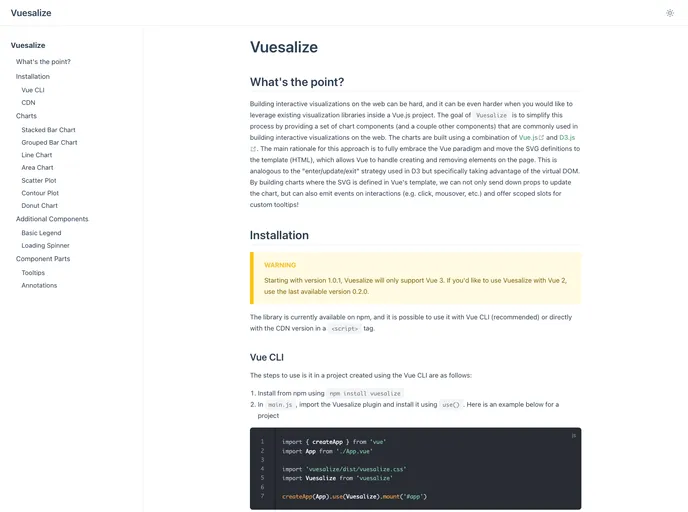
To install Vuesalize, follow the appropriate guide based on your setup:
npm install vuesalizemain.js file, import the Vuesalize plugin: import { Vuesalize } from 'vuesalize'use() method: app.use(Vuesalize)createApp({...}).app.use(Vuesalize) after creating the app instance.Vuesalize is a library that simplifies building interactive visualizations on the web within a Vue.js project. It provides chart components and other commonly used components, all built using a combination of Vue.js and D3.js. By moving the SVG definitions to the template, Vuesalize makes it easier to update and interact with the charts. The library can be installed using npm or used with the CDN version.